See a meteorite fall in the radar
When a meteorite fall's debris drifts to the ground it briefly shows up in NEXRAD Doppler weather radar. Fireball networks tell us when and where to look; MetDetect answers which radar echoes are the falling debris. Each event below shows every candidate the detector surfaces, with the ones clearing its 10%-false-alarm operating point marked; false positives are left in, and every run uses the current pipeline. Everything renders in your browser.
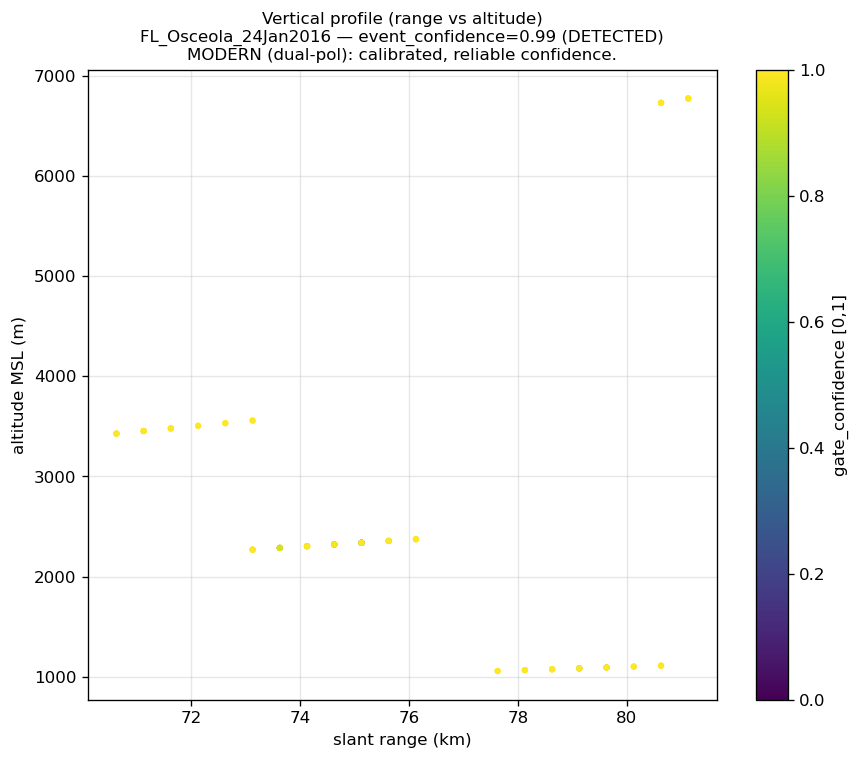
What am I looking at? Each dot is a radar “gate” inside a candidate the detector flagged at its operating point, colored by reflectivity. Real falls appear as an elongated streak — fragments strung out along the wind as they descend. The 3D view shows the same gates at their true altitudes. The radar site is marked ✳; ◆ marks the candidate's centroid. Rings around dots mark agreement with the manually identified truth.
This is a preloaded demo of precomputed results (the site is served as static pages; the desktop app can't run here). A live companion tool — upload a fireball, search the radar on demand — is planned. See the MetDetect and research pages.
How MetDetect works
A window of raw NEXRAD Level-II radar (~10⁶ gates) is reduced, stage by stage, to a handful of candidate debris clusters, and a null-trained detector scores each against real no-fall radar behavior.